Map lets you visualize Container shipping traffic around the world
Integrative Global shipping map
Global Shipping Visual interactive Map
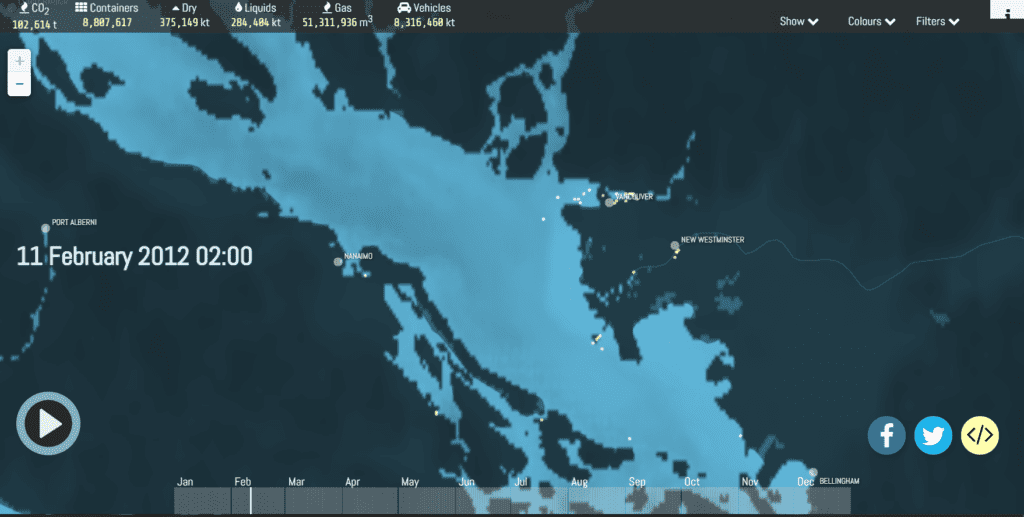
This interactive data map, created by Kiln is based on research from UCL Energy Institute, which visually shows global shipping traffic from Jan 2012 to Dec 2012. Filters about the cargo that is being shipped can be applied, these filters Total number of containers carried by ships, total dry bulk carried by ships (shown in kilo tons), total wet bulk carried by ships (shown in kilotons), Total gas carried by ships (shown in cubic meters), dead weight tonnage of vehicle carriers (shown in kilotons) . The container ships are represented by yellow dots travelling across the map.